

B2B digital marketing benchmarks give you a clear picture of how your marketing stacks up. With the digital space getting more competitive each year, especially in 2025, it’s harder to know what’s working and what needs work. Benchmarks help you cut through the noise. They show whether your campaigns are delivering results or just ticking along.
When you compare your results to B2B digital marketing benchmarks, it’s easier to spot gaps, make improvements and focus on what actually drives growth.
Contents
- B2B Email Marketing Benchmarks
- B2B Social Media Benchmarks
- B2B Website Benchmarks
- How to Use These Benchmarks to Drive Growth
- Final Thoughts: Turning Data into Direction
B2B Email Marketing Benchmarks
Email is still the workhorse of B2B digital marketing. It reaches decision-makers directly and drives measurable results when executed with purpose and consistency. But not every email strategy performs equally well. The difference between average and outstanding email marketing often comes down to segmentation, message quality, and CRM integration.
Here’s what to aim for:
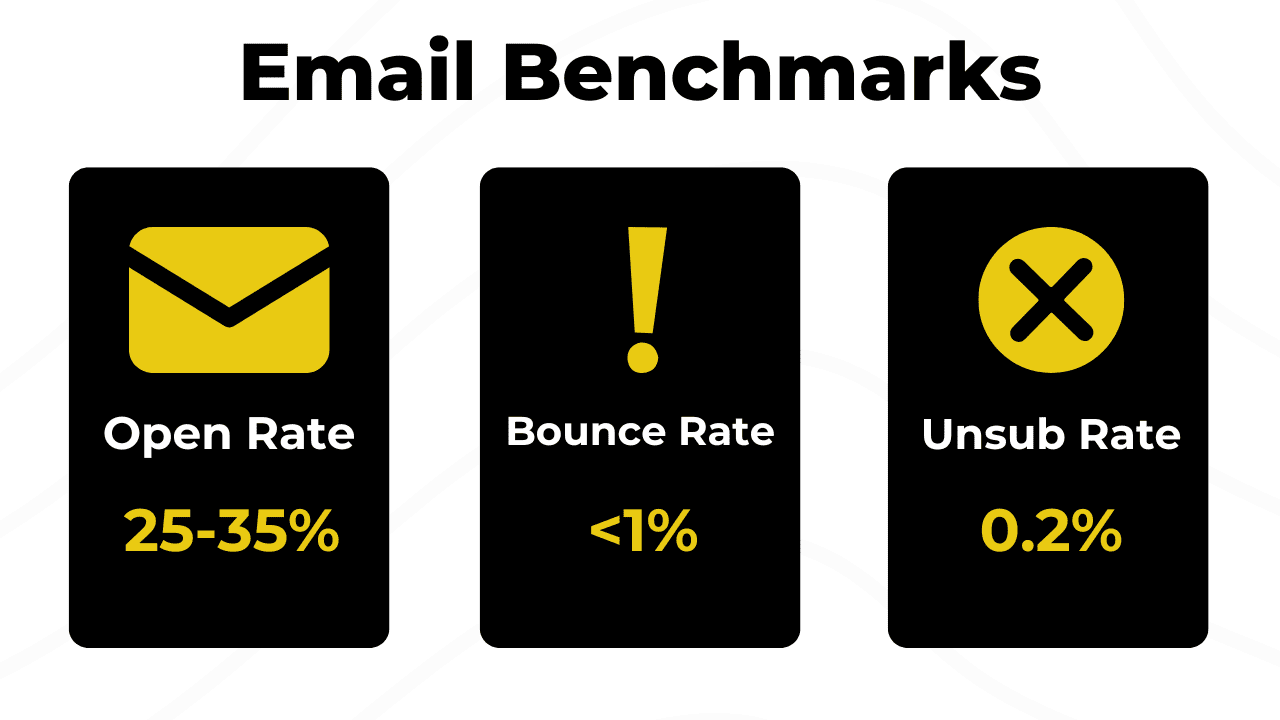
- Average Open Rate: 25–35%
The best performing newsletters often exceed 35%, especially when messages are tailored to segmented CRM lists. - Average Bounce Rate: Under 1%
Higher rates suggest outdated data or deliverability issues. - Unsubscribe Rate: Around 0.2% per send
This figure reflects healthy list hygiene and value-led content.
If your open rate dips below 20%, revisit your subject lines, audience segmentation, or send frequency. Frequently hard bounces may signal its time for a CRM clean-up or a check of your sender reputation.
B2B Social Media Benchmarks
Social media is where your brand’s personality and expertise come through. It’s also one of the clearest indicators of trust and engagement from your audience. In 2025, LinkedIn is still the key platform for B2B, but results will always vary depending on your industry, niche and the kind of audience you’ve built.
To give you a useful point of comparison, here are a few percentage-based benchmarks that apply broadly across B2B, with a particular focus on LinkedIn:
Typical B2B social media benchmarks:
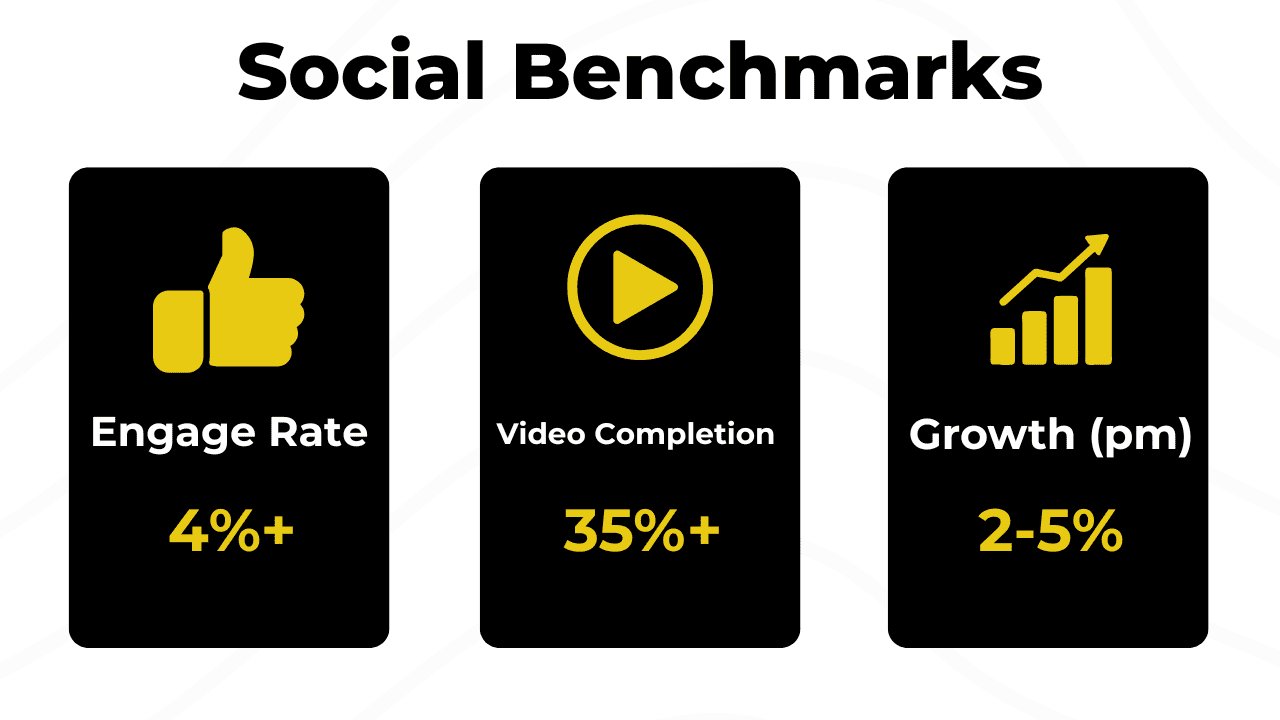
- Engagement rate: 1 to 3% is common, 4 to 6% is considered strong
- Video completion rate: 35 to 50% or higher
- Follower growth rate (monthly): 2 to 5%
At Digiwoods, we’ve seen stronger engagement when content is built around clear content pillars. Posting regularly and offering consistent value helps build trust, authority and visibility – all of which support long-term growth.
While metrics like likes and follower numbers are useful, they’re only part of the picture. The real signs that your content is working are things like thoughtful comments, meaningful conversations and direct enquiries. Those are the outcomes that signal a healthy and active presence.
Tracking your performance over time and comparing it against B2B digital marketing benchmarks helps ensure your social strategy stays relevant and impactful. Social content is never finished – it can always be improved. Video, in particular, takes more effort to produce, but it plays a bigger role in building familiarity and trust before a prospect ever reaches out.
“Nearly 9 in 10 decision-makers say thought leadership content influences their perception of a company, and more than half say it directly impacts their purchasing decisions.”
Source: Edelman & LinkedIn 2024 B2B Thought Leadership Impact Report
B2B Website Benchmarks
Your website is often the first meaningful interaction a prospect has with your brand. Every click tells a story about how clear your messaging is, how relevant your content feels, and whether visitors trust you enough to take the next step.
B2B website performance is very different from B2C. Buyers take longer to make decisions and often return several times before converting. Results also vary depending on the type of page and the industry you are in, so the benchmarks below are intended as general guidance.
For example, a high bounce rate on a contact or blog page is not necessarily a bad thing. It can simply mean the visitor found what they needed quickly and left, which may be exactly what the page is designed to do.
What strong website performance looks like in 2025:
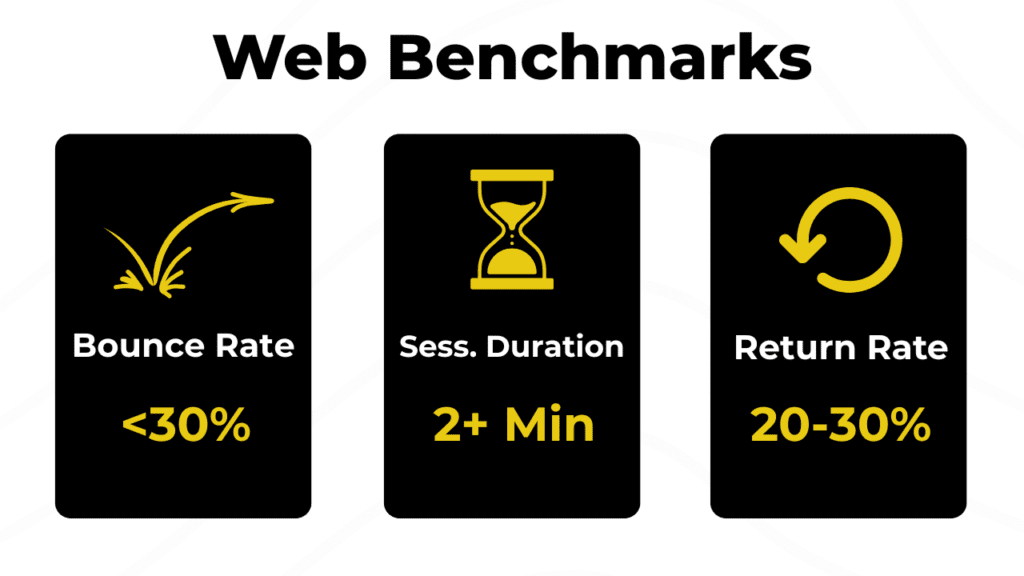
- Bounce Rate: Less than 30% across most industries.
- Session Duration: 2+ minutes for blogs and service pages.
- Returning Visitor Rate: 20–30%.
If your bounce rate is consistently high, it might be worth looking into issues like slow load times, unclear calls to action or content that does not match what users are looking for. Website optimisation is not just about how it looks. It is about helping the right people find what they need quickly and confidently.
How to Use These Benchmarks to Drive Growth
Benchmarks matter only when they lead to smarter decisions. Think of them as signposts that help you set realistic goals and decide where to focus your marketing energy.
“If you can measure marketing, you can control it and radically improve performance”
Source: Mark Jeffery, Data-Driven Marketing: The 15 Metrics Everyone in Marketing Should Know
A few practical steps might be:
- Set measurable quarterly targets for each channel.
- Watch for trends like gradual drops in open or engagement rates.
- Invest time and resources in areas that show clear returns.
By tracking your performance across email, social, and web consistently, you can improve the effectiveness of your marketing. It’s not only about knowing the numbers but using them to make every part of your digital marketing smarter. If you’re ready to take a more strategic approach, our B2B marketing strategy service can help you use your numbers to plan smarter and grow faster.
Turning Data into Direction
Benchmarks show where you are, but they also reveal where you could be. The most successful B2B brands in 2025 aren’t the loudest; they’re the most informed. They read their numbers, refine their approach, and evolve continuously. Whether it’s tightening your CRM workflows, improving your content rhythms, or enhancing use experience, every metric is an opportunity to grow smarter.